Global Flight Intelligence Pipeline
Tech Stack
 Kafka
 ClickHouse
 Grafana
 Go
 OpenSky
Kafka
ClickHouse
Grafana
Go
OpenSky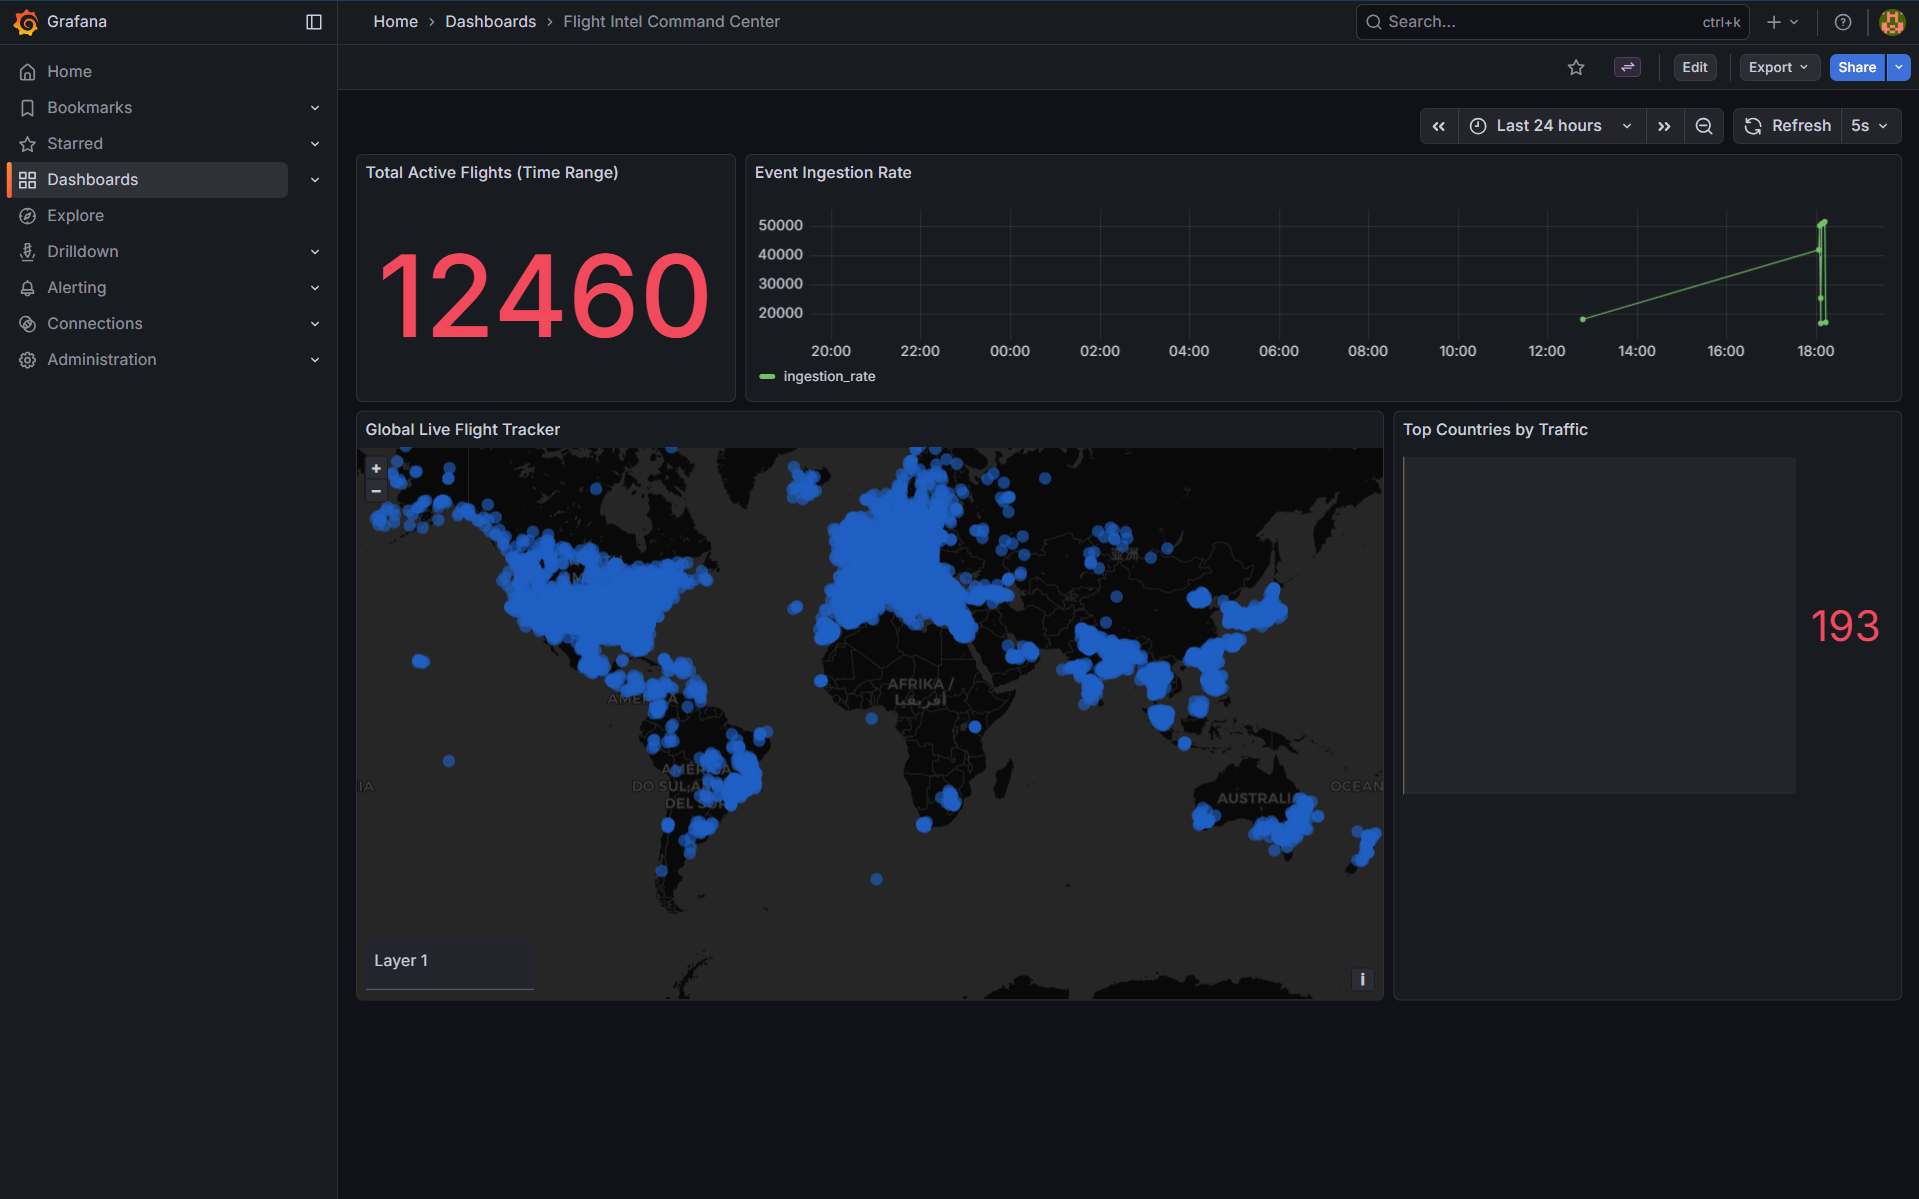
A real-time, end-to-end pipeline that captures, processes, and visualizes global flight movements. It highlights modern streaming architecture, distributed processing, and fast analytical storage.
Architecture
- Source: live flight vectors from the OpenSky Network API.
- Producer (Go): polls the API and publishes raw events to Kafka.
- Kafka (KRaft): high-throughput messaging between ingestion and storage.
- Consumer (Go): reads from Kafka and bulk-loads into ClickHouse.
- ClickHouse: columnar store with MergeTree-style tables tuned for time series.
- Grafana: native ClickHouse plugin for live geomaps, time series, and gauges.
Features
- Live geomaps of position, altitude, and speed.
- Schema tuned for fast ingestion at scale.
- Grafana as code — data sources and dashboards provisioned from repo (minimal manual UI setup).
- Go concurrency — goroutines, context, and graceful shutdown.
Run it
Prerequisites: Docker & Compose, Go 1.20+.
docker compose up -d
go run cmd/producer/main.go
go run cmd/consumer/main.go
Open Grafana at http://localhost:3000 (default admin / admin). Go to Dashboards → Flight Intel Command Center.
Source code: github.com/azzammasood.